Watch the September 9, 2026 Bitcoin analysis on YouTube — 11 min 42 sec, Full HD (French)
Bitcoin: constructive daily structure, short-term pressure
September 9, 2026 edition (Europe/Paris). Candles collected September 8 between 22:47:54 and 22:48:05 UTC. The September 8 UTC day is not closed. Indicators use completed candles only. The general site header shows a separate price that may change. Click charts for full size; chart labels are in French in both language versions.
01 — Opening and reference points
Hi, my little sweethearts
Today, we are changing the format. No news roundup: we are opening Bitcoin’s charts and taking the time to read the candles. We start with the monthly chart, then move down to the weekly, daily, four-hour and one-hour charts. The idea is to understand what each timeframe tells us, without confusing an intraday bounce with a reversal in the underlying trend.
This briefing is dated September 9 in Paris, with data collected on September 8 around 22:48 UTC. The Binance spot cross-check was approximately 78,524 USDT. September 8 was still open; the latest completed daily candle is September 7.
All the levels shown come from the Bitcoin against Tether spot market on Binance. They are expressed in USDT, not dollars. Our cross-check on another platform is kept separate. Candles that are still open are flagged: until they are complete, their shape can change. We do not use them to announce a confirmed signal.
02 — Monthly: setting the scene
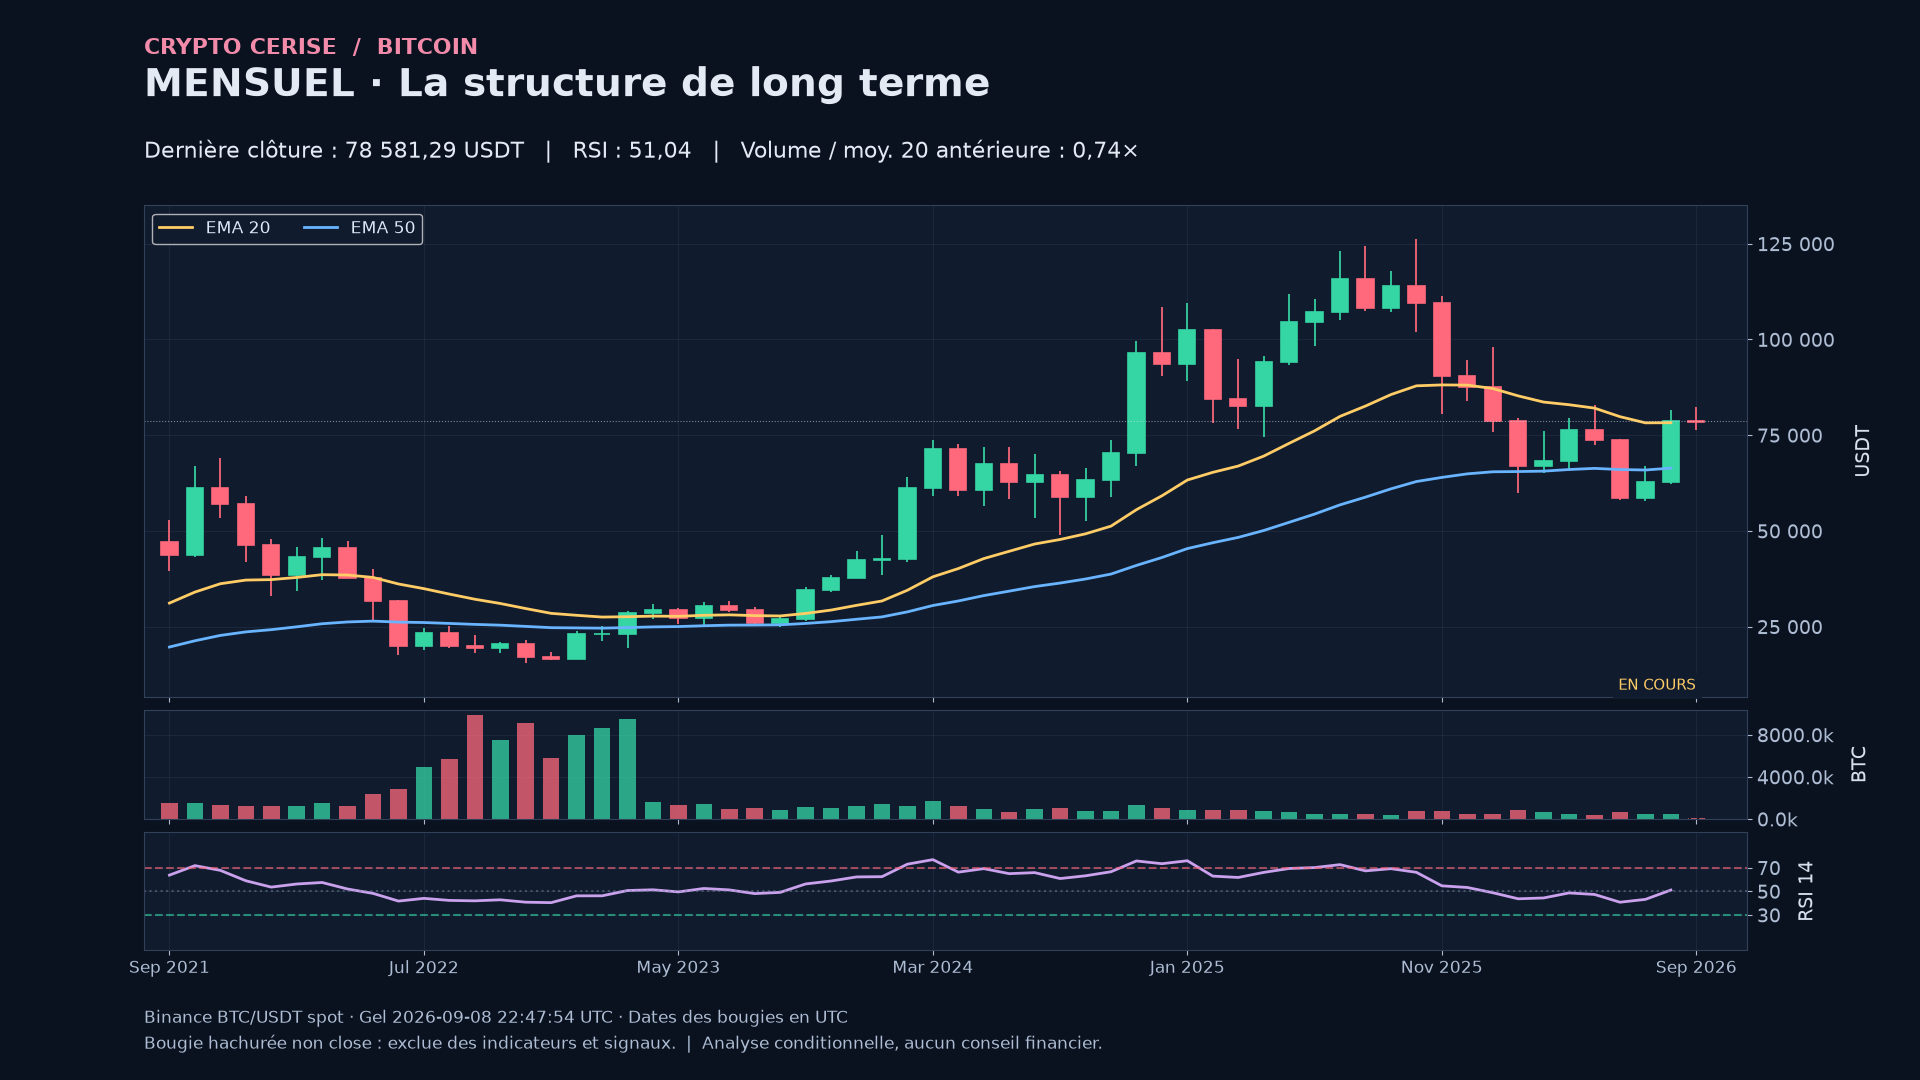
On this first chart, one candle represents an entire month. Its body connects the open to the close; its wicks show the high and the low. A wick is not proof of manipulation. It simply shows a price that was reached and then left behind before that candle closed.
August opened near 62,888 and closed near 78,581 USDT, producing a bullish body. Its high was around 81,479. The close finished slightly above the monthly 20-period exponential average. This is a descriptive improvement, not proof that a lasting new advance is secured.
The current month is not over. We can describe its open, its range and its last observed price; we cannot assign it a definitive monthly close. I prefer an observation that is less spectacular but accurate to a premature reversal headline.
03 — Weekly: the link between timeframes
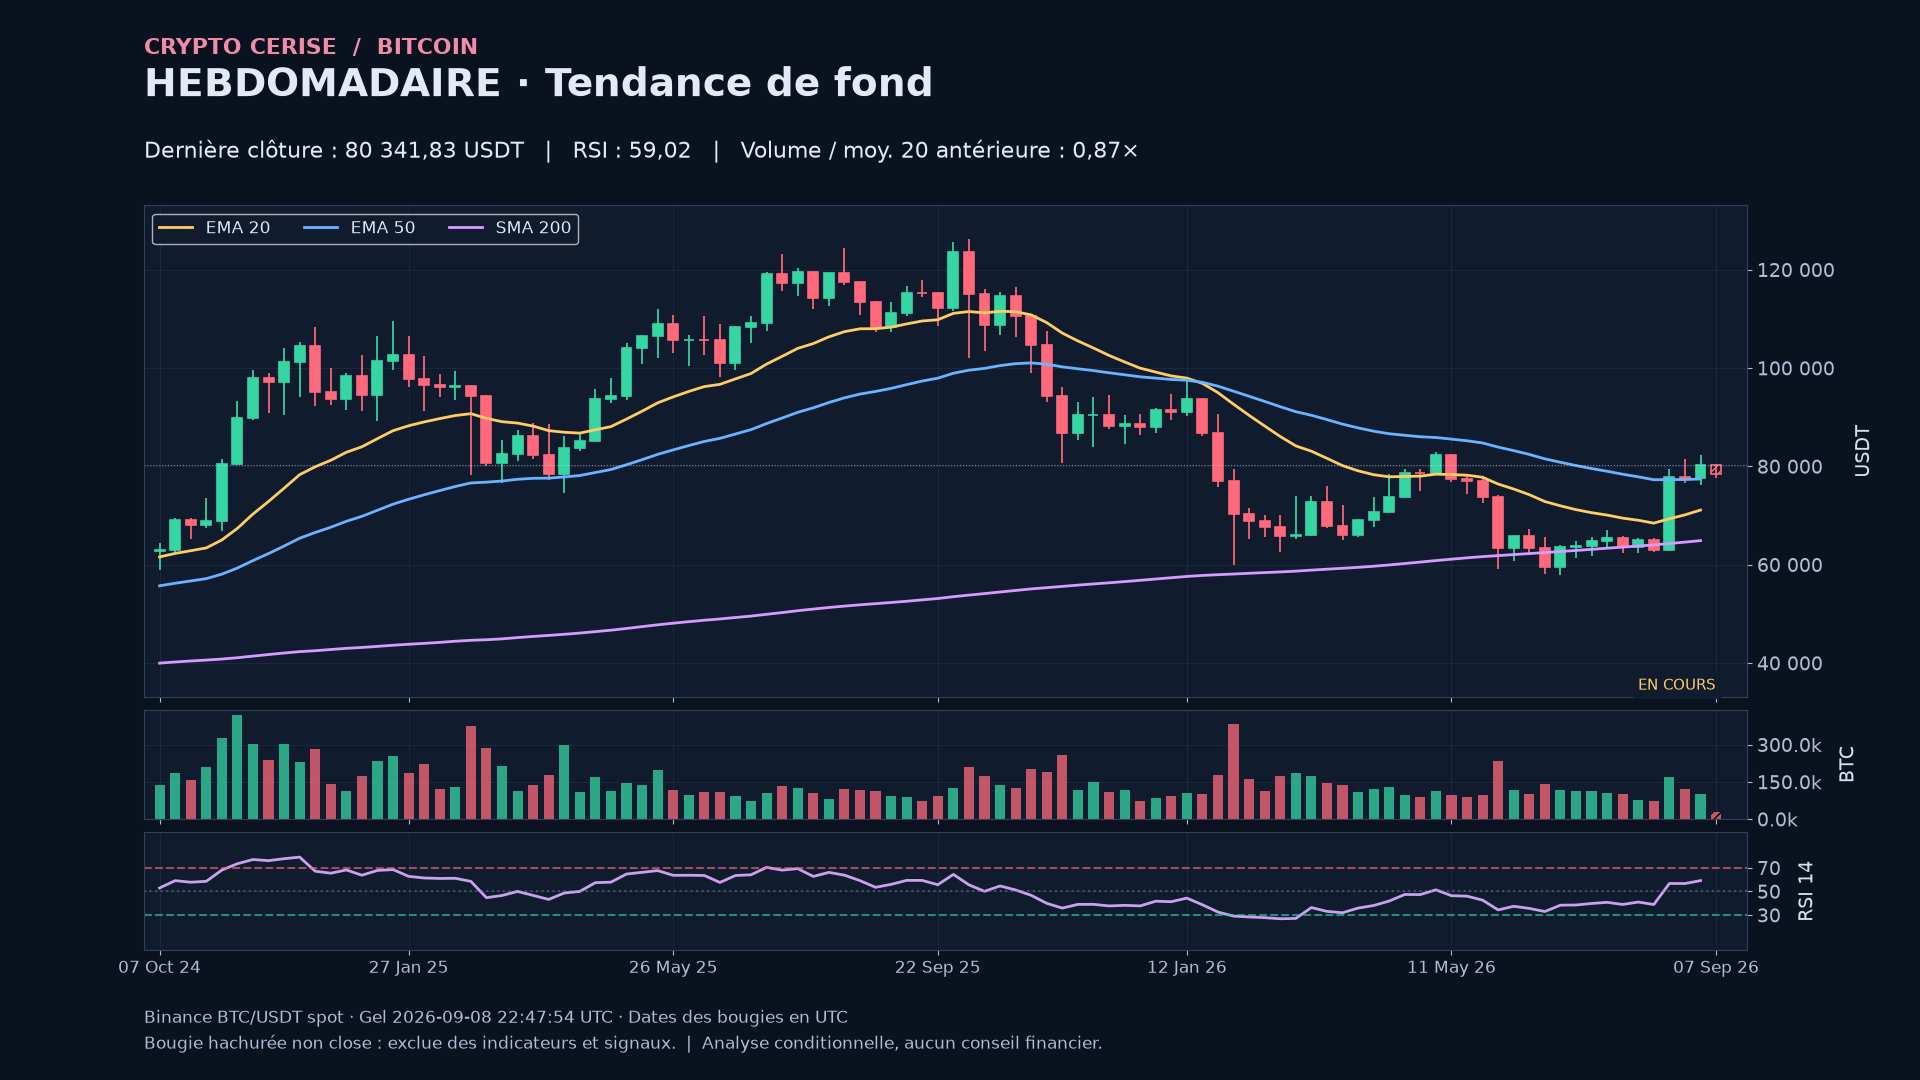
Let us move on to the weekly chart. This chart connects the broader structure with the movements of the past few days. To draw the zones, we identify local highs and lows confirmed by candles on either side. This introduces a deliberate lag: a high that has only just formed does not automatically become a validated resistance level.
The last completed week, August 31 through September 6, closed near 80,342 USDT. It remains above both displayed exponential averages. However, the 20-week average remains below the 50-week average: the alignment is not fully restored. The upper historical reference highlighted here is near 82,850.
These reference points are not walls: the price response still needs to be observed. We cannot infer hidden orders from a few candlesticks.
04 — Daily: price and moving averages
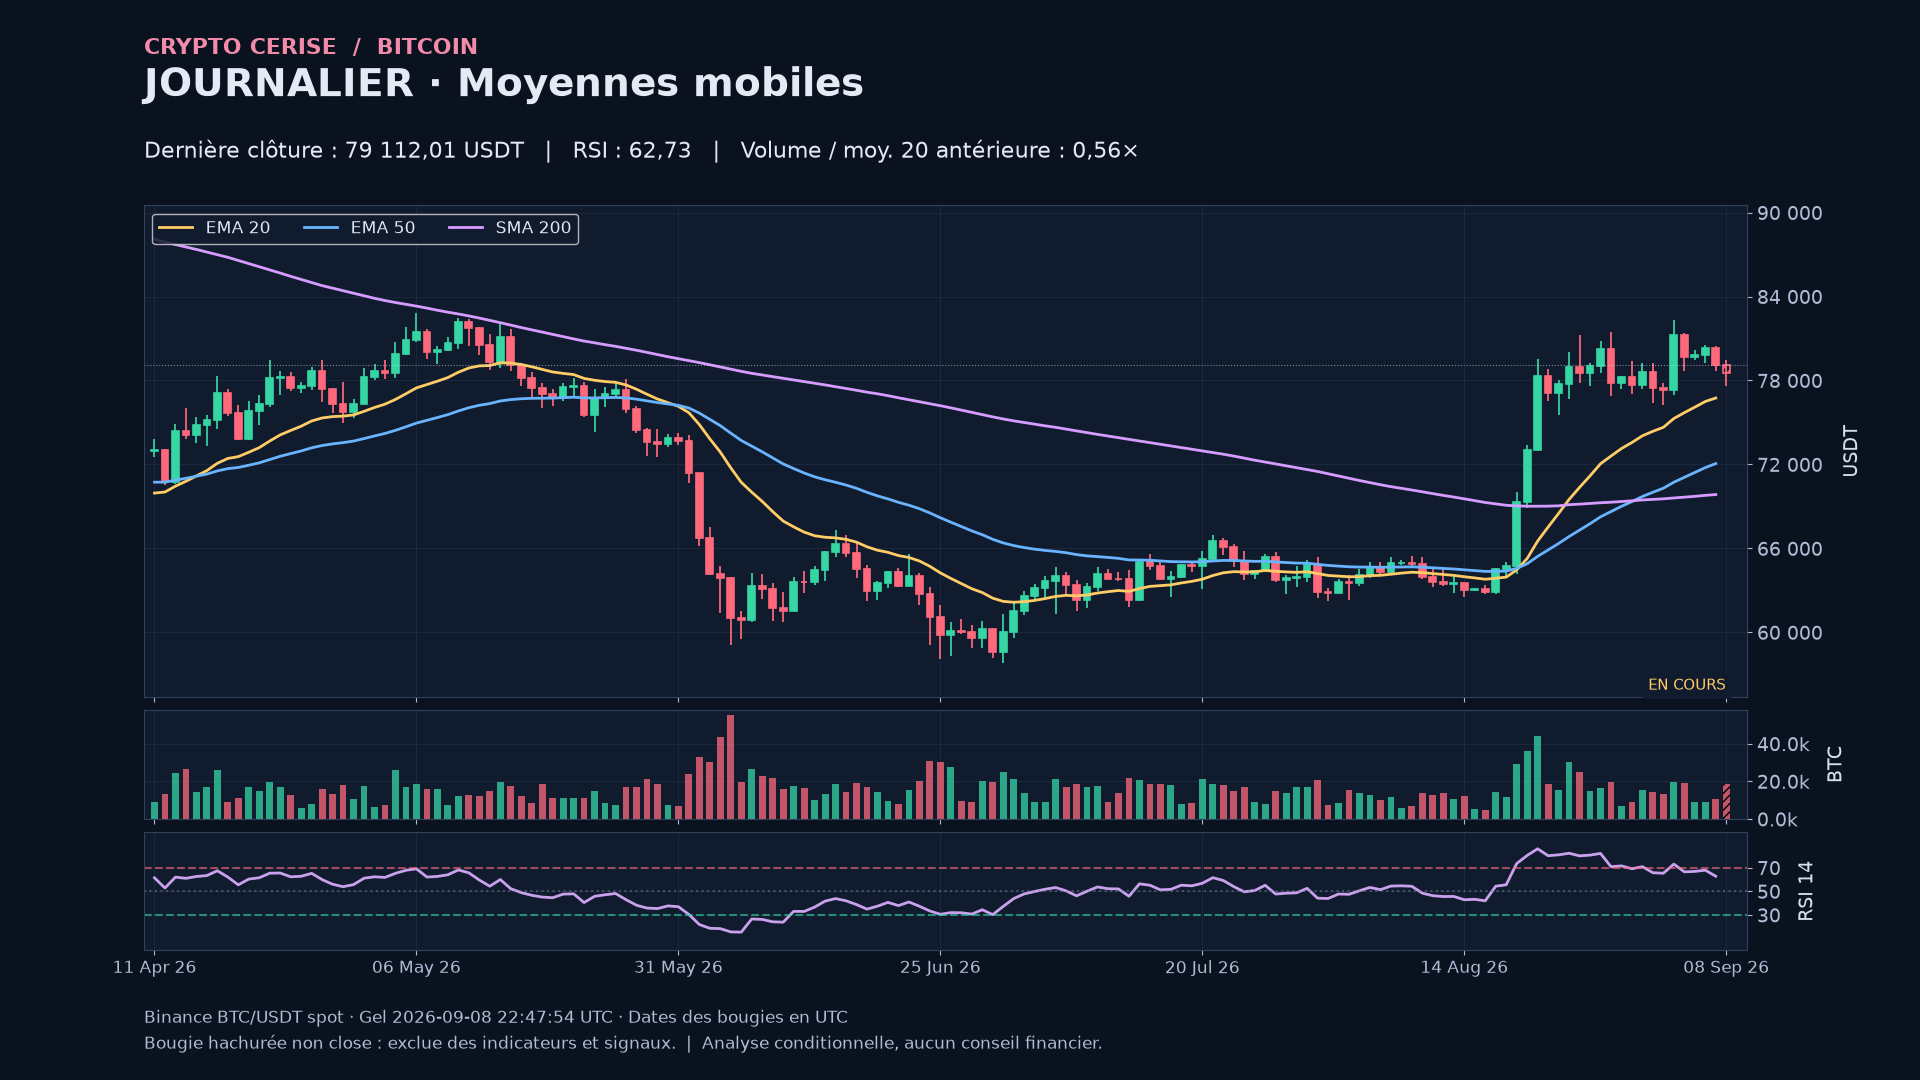
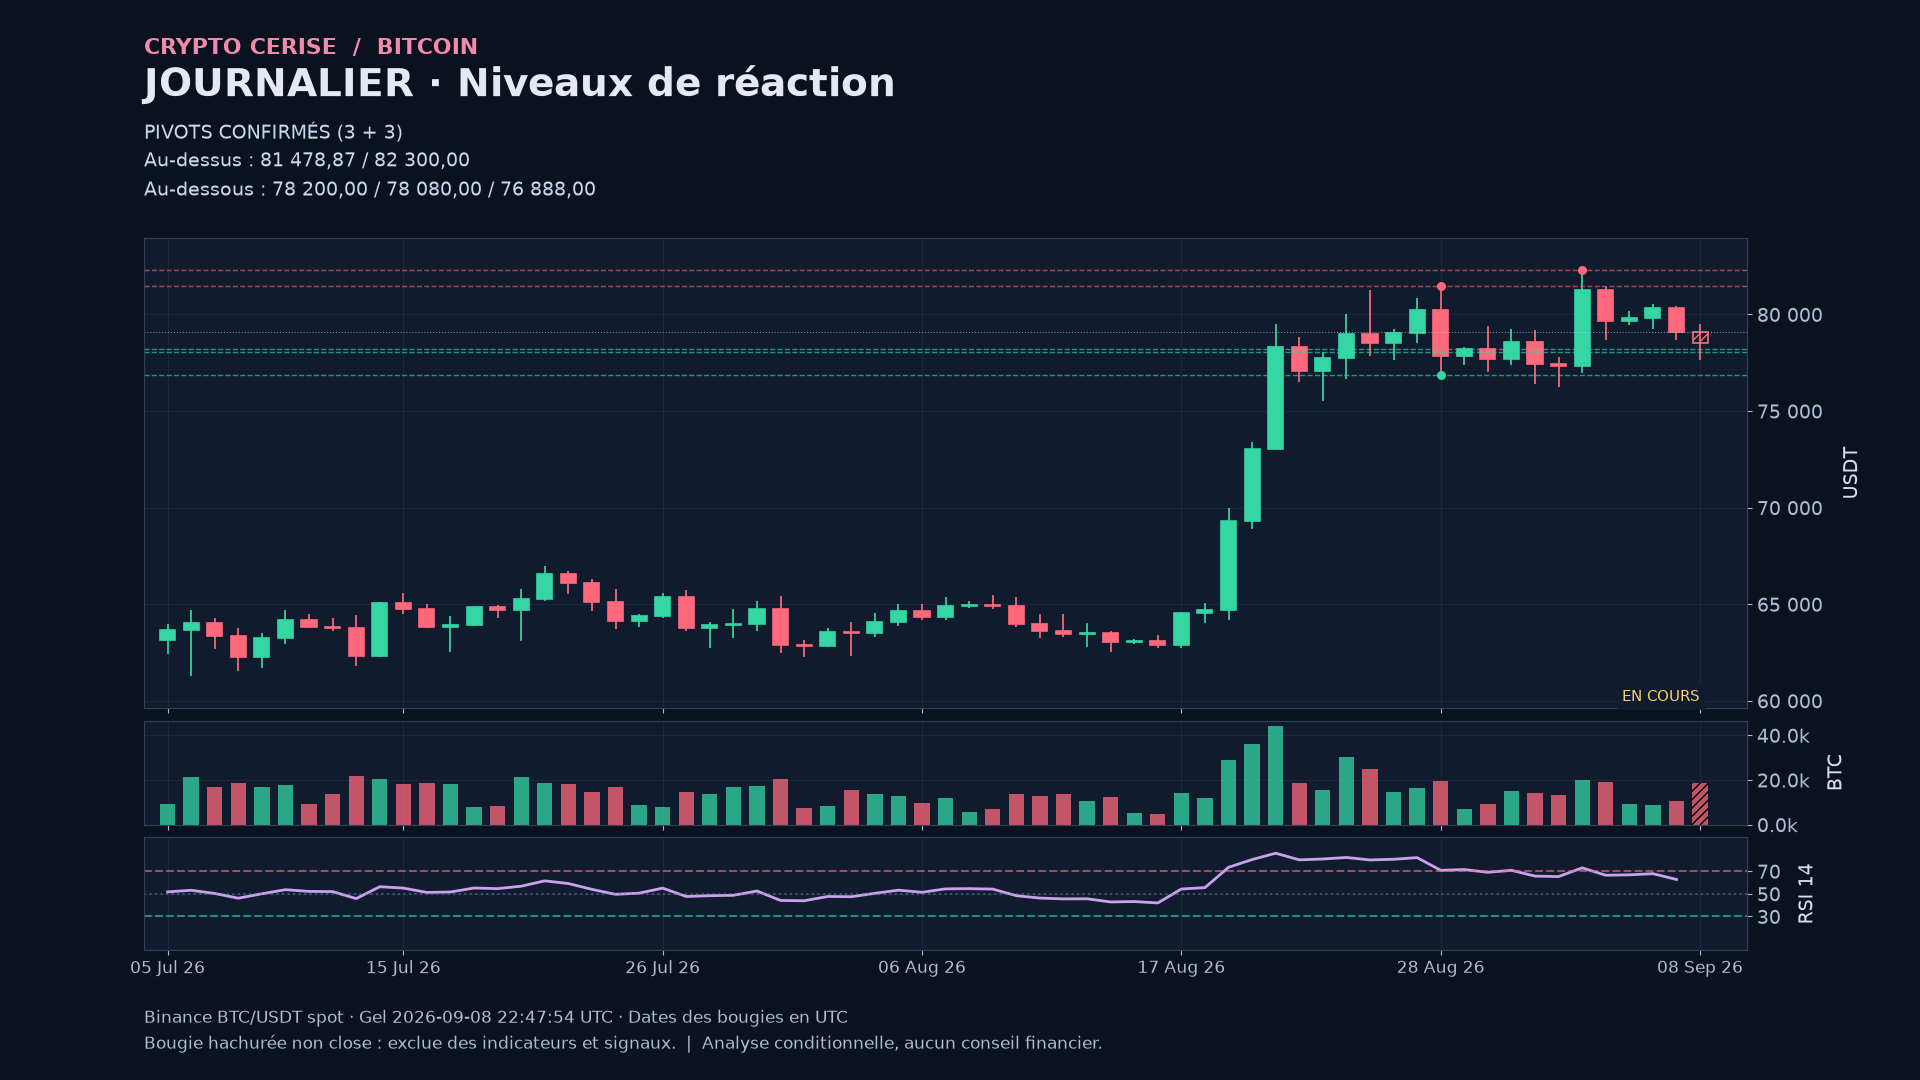
Here we are on the daily chart. One candle represents one UTC day. I am showing two exponential moving averages, over twenty and fifty periods, along with a simple moving average over two hundred periods. The exponential averages give more weight to recent prices; the simple average provides a slower reference point.
At the September 7 close, price is near 79,112 USDT, above all three averages. The 20-day average is around 76,747, the 50-day around 72,060, and the simple 200-day around 69,849. Their ordering is constructive, despite a red daily candle. Above price, two confirmed highs provide references near 81,479 and 82,300.
A moving average is not a magnet that forces price to return to it. It is a transformation of past closing prices. What matters to us is the overall picture: where price sits, how the averages are arranged, and whether the horizontal zones tell a consistent story.
When reading candles, I look at the body, the wicks and, above all, where the candle closes relative to the zone being tested. A spike above resistance followed by a return below it does not mean the same thing as a close above it followed by price holding there. But none of these observations guarantees what the next candle will do.
The volume bars below the price represent the bitcoins traded on this pair and this platform. They do not represent the entire global market. For a proper comparison, we use completed candles of the same duration; the volume of a day that is still in progress is not directly comparable with that of a full day.
05 — Ichimoku: a separate view
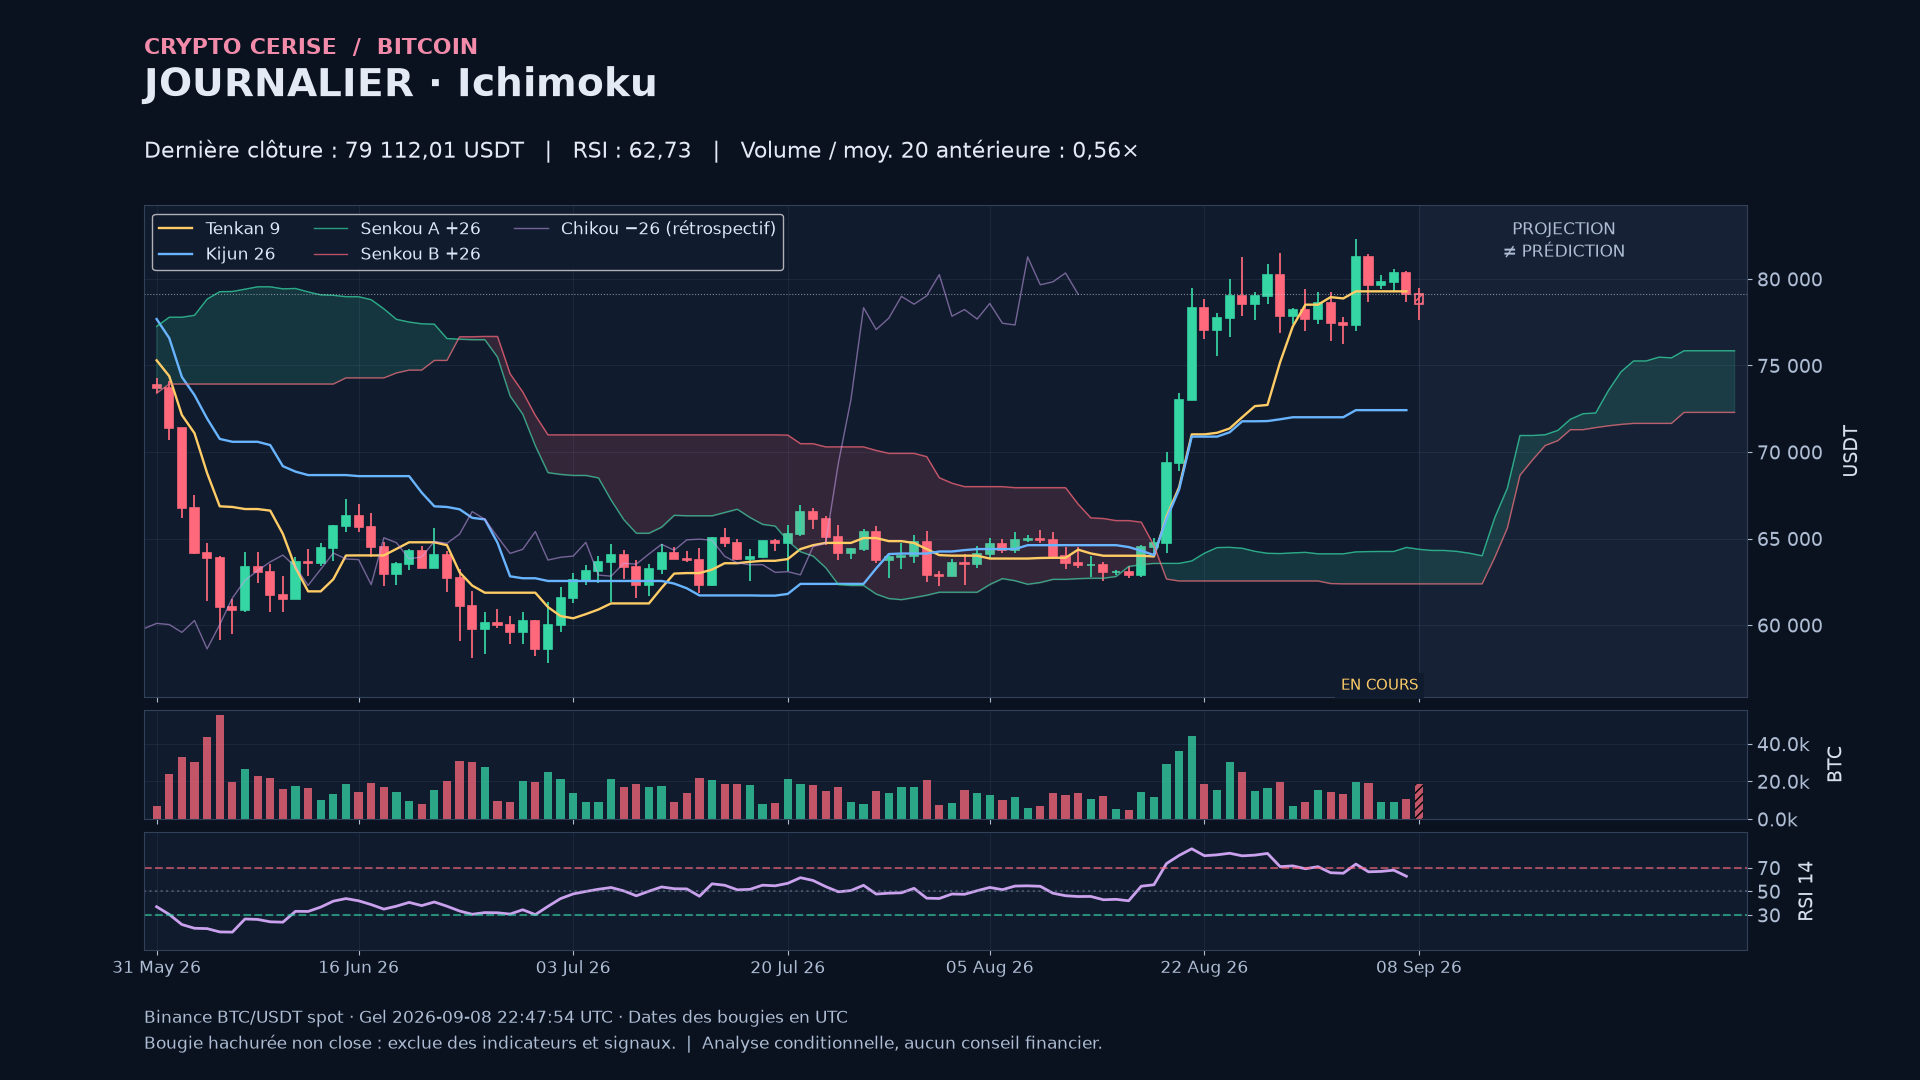
I am now removing the conventional moving averages to display Ichimoku. Otherwise, with all the lines overlapping, we would end up losing sight of the candles.
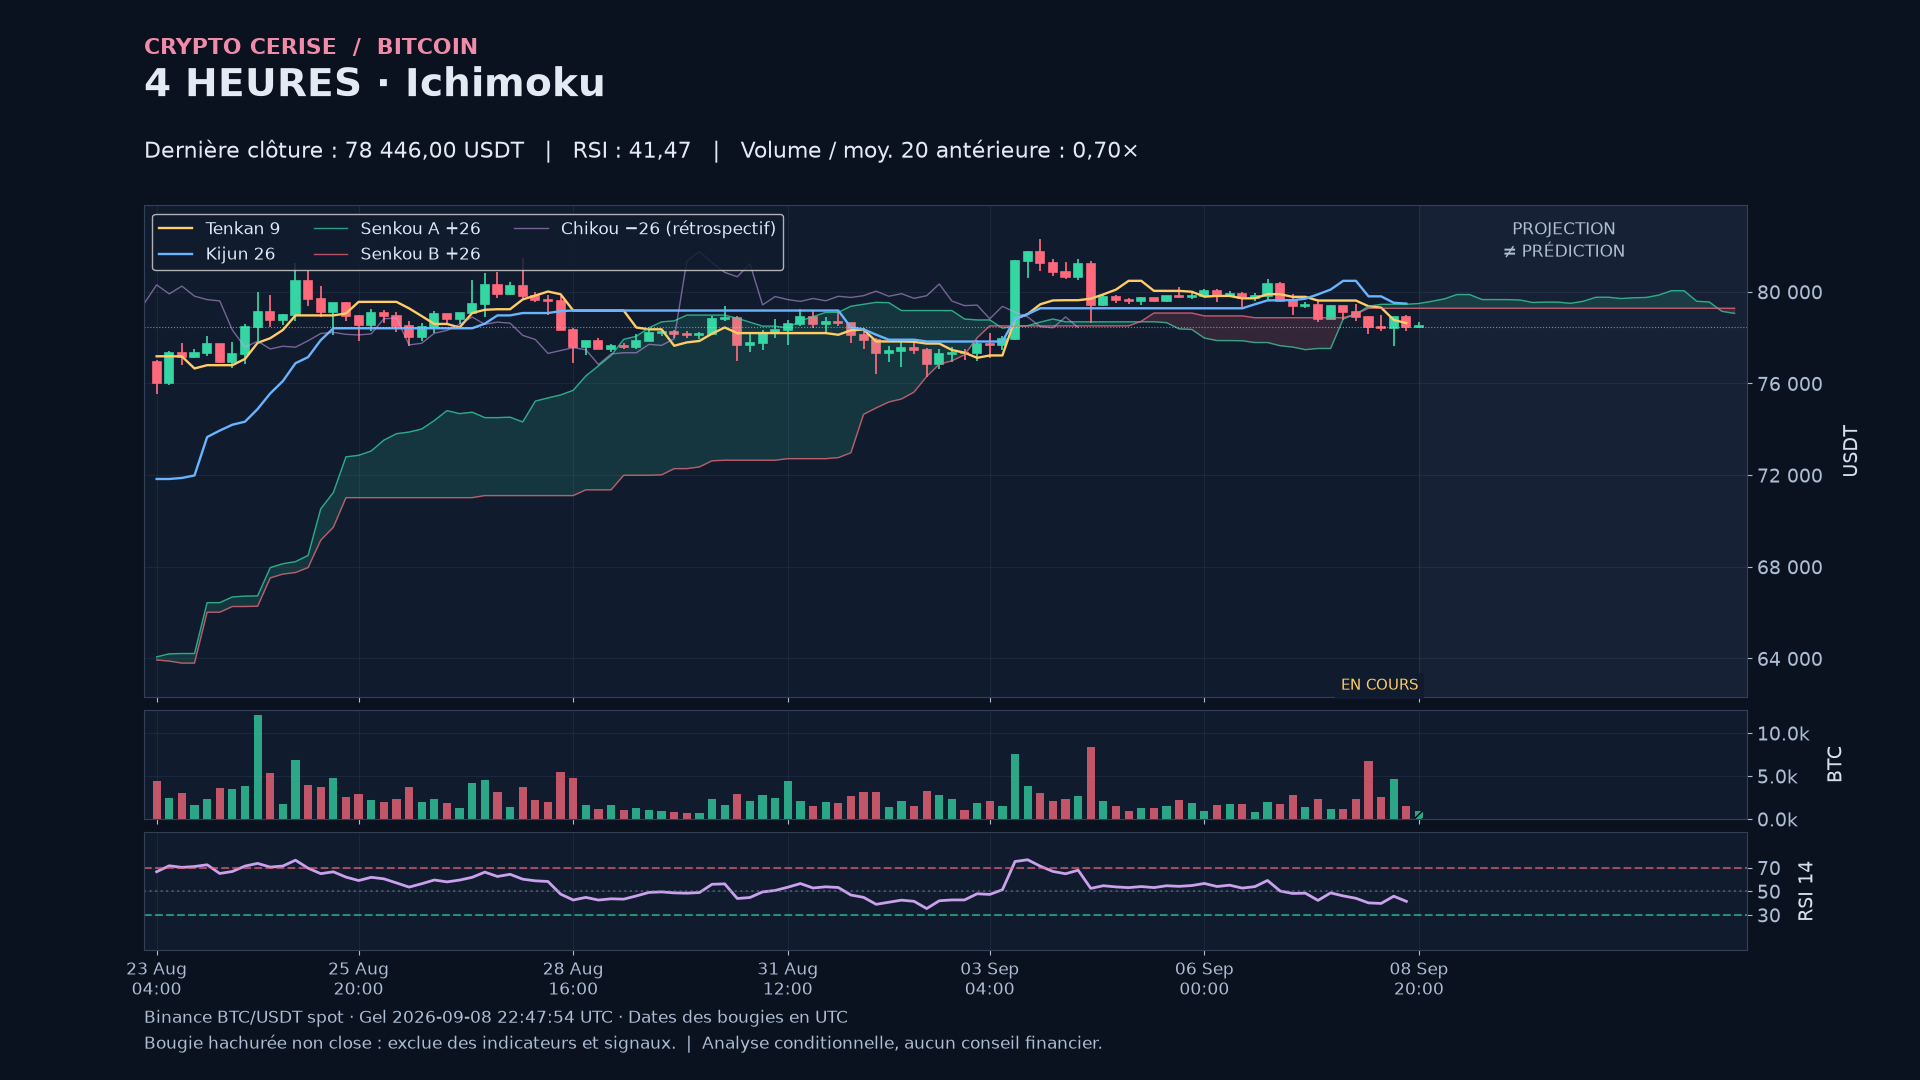
We use the standard settings: nine, twenty-six and fifty-two periods, with a twenty-six-period displacement. The Tenkan takes the midpoint between the highest high and the lowest low over the last nine periods. The Kijun makes the same calculation over twenty-six periods. They are therefore not averages of closing prices.
The cloud brings together two lines: the first comes from the midpoint between Tenkan and Kijun; the second from the midpoint between the extremes over fifty-two periods. They are plotted ahead. This does not mean the future is known: what is projected is still calculated from past data.
On the last completed day, price remains above the cloud at that date. Tenkan is near 79,282 USDT: the close is slightly below it. Kijun is much lower, near 72,418. My interpretation is therefore nuanced: the daily Ichimoku framework remains constructive, but short-term momentum is not holding every reference.
The important comparison is with the cloud at the same date as the price. Comparing today’s price with the end of the cloud projected to the right would change the question and could produce a misleading reading. Above the cloud, the trend reading is more constructive; below it, more fragile; inside it, more hesitant.
And beware of a false accumulation of evidence. Moving averages and Ichimoku both use price. When they agree, that adds consistency to the reading, but they are not two independent sources of information. I do not turn three similar indicators into three guarantees.
06 — Four hours: refining the structure
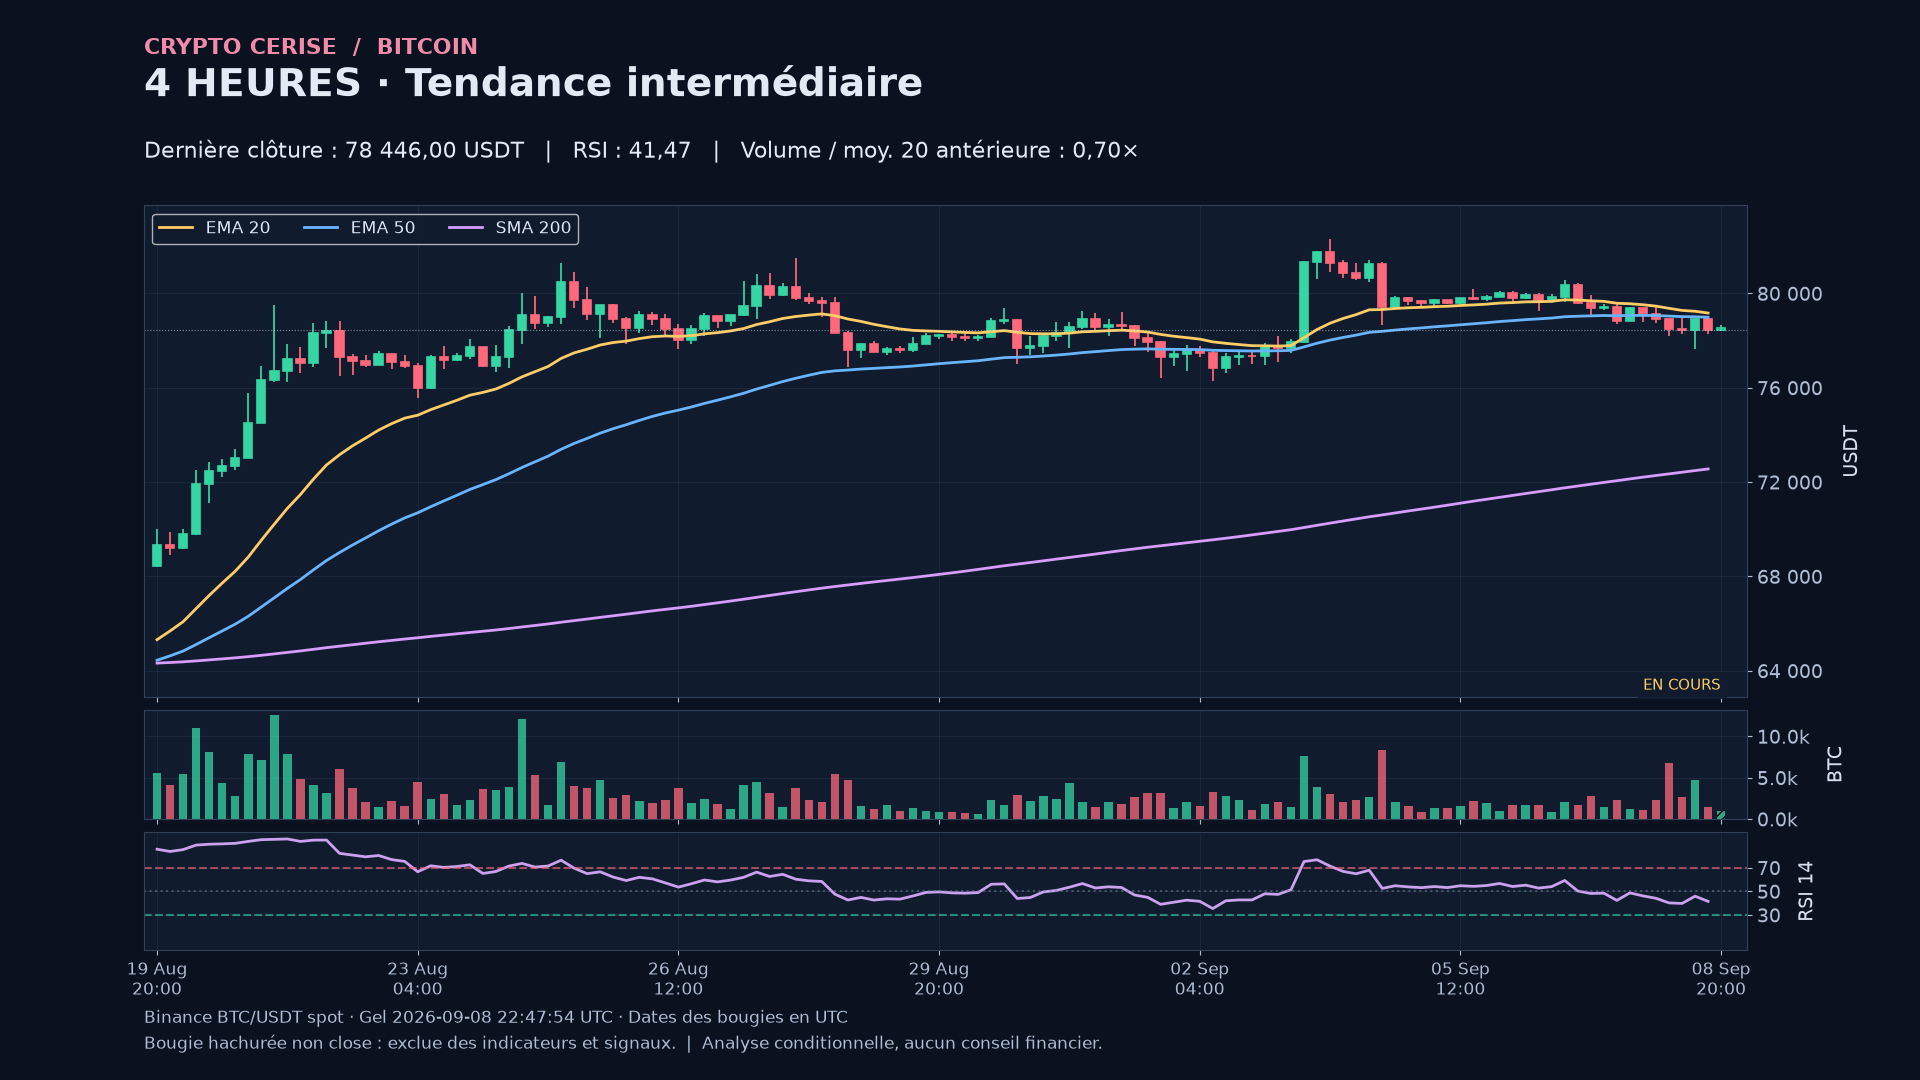
Let us move down to the four-hour chart. This timeframe allows a closer look at how the market moves between the daily chart’s zones, without reacting to every small fluctuation.
The last completed four-hour candle closes at 78,446 USDT, just before 20:00 UTC. It is below both exponential averages and below the cloud. The two averages lie roughly between 78,987 and 79,166. Unlike the daily view, this describes a more fragile phase. RSI near 41 is consistent with that reading.
What I would watch for on this view is a close beyond a zone, followed by the ability to hold it. A return to test the level that was crossed can provide additional confirmation, but that return is neither required nor assured. Conversely, quickly moving back into a zone that price had just moved beyond weakens the breakout scenario.
07 — One hour: avoiding confusion between speed and trend
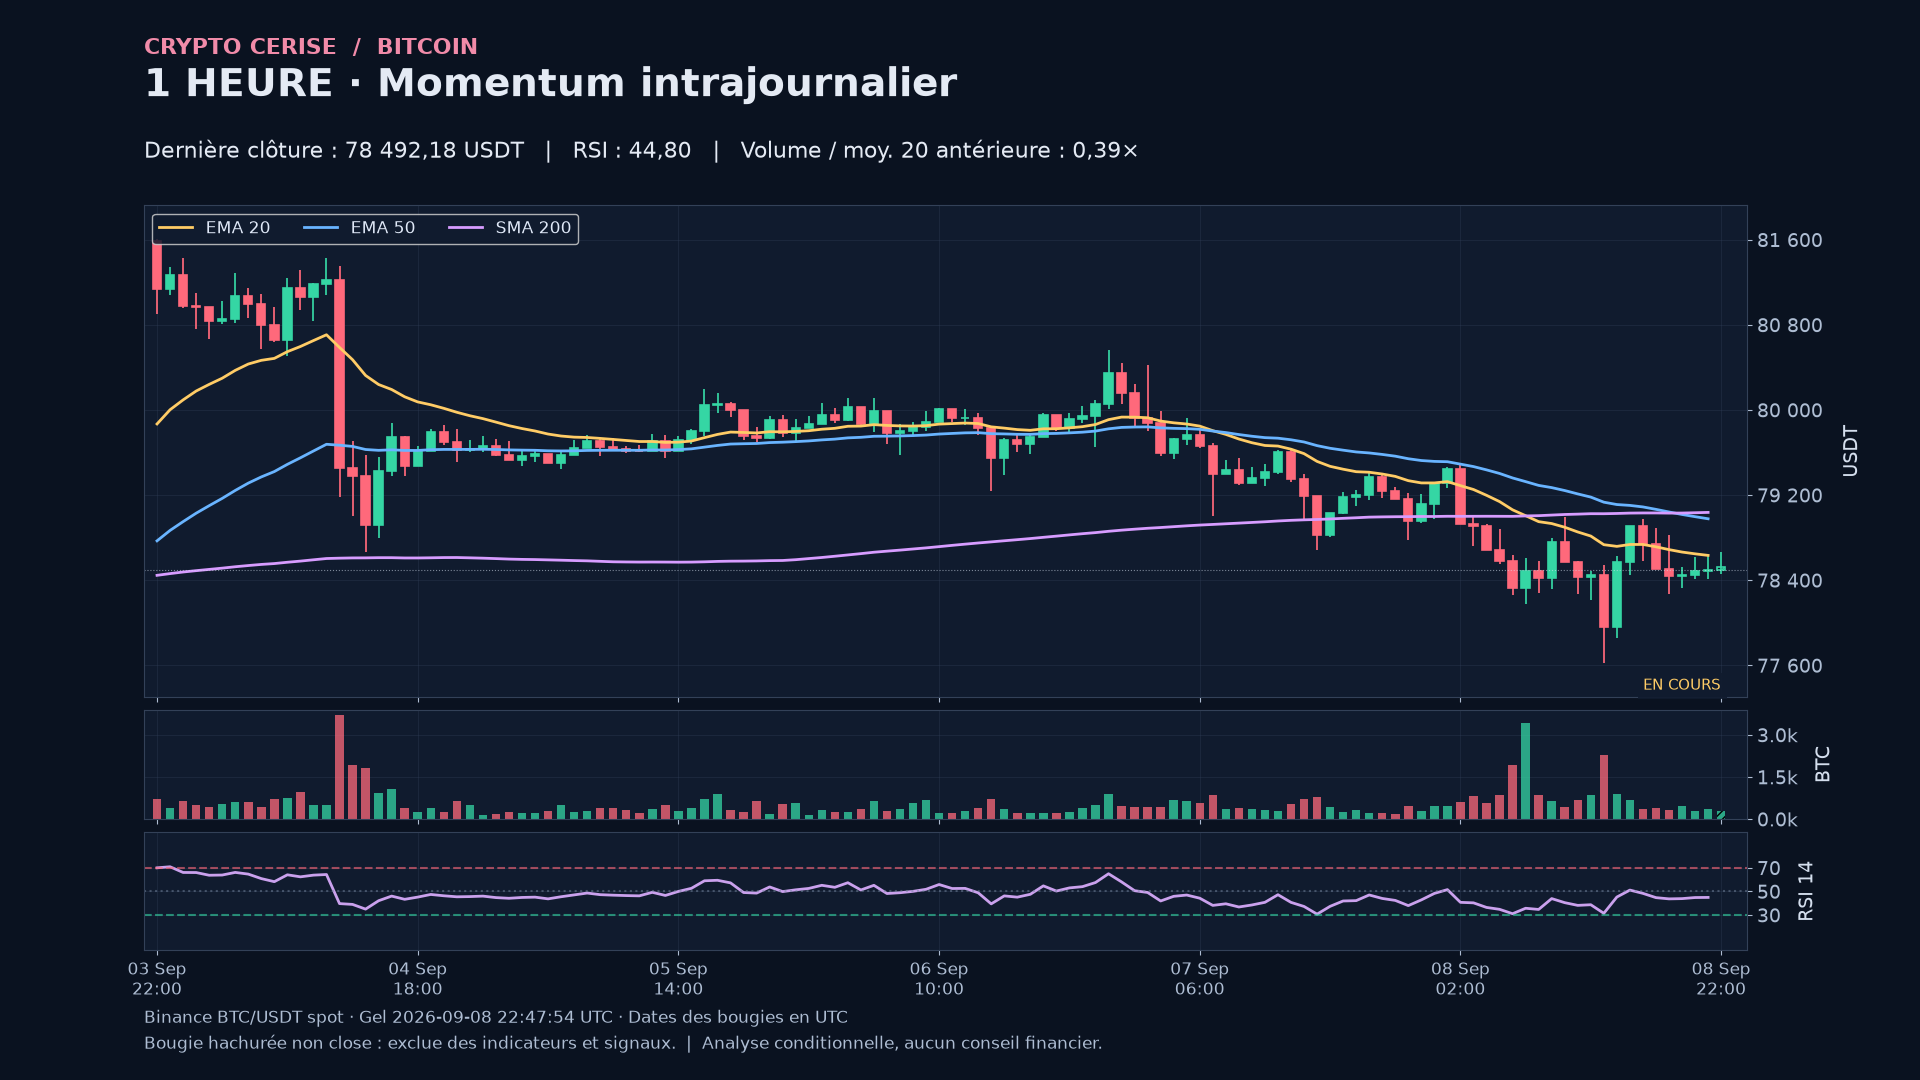
On the one-hour chart, price action becomes more responsive, but also noisier. This chart is used to observe how a scenario unfolds, not to erase the context we have just built.
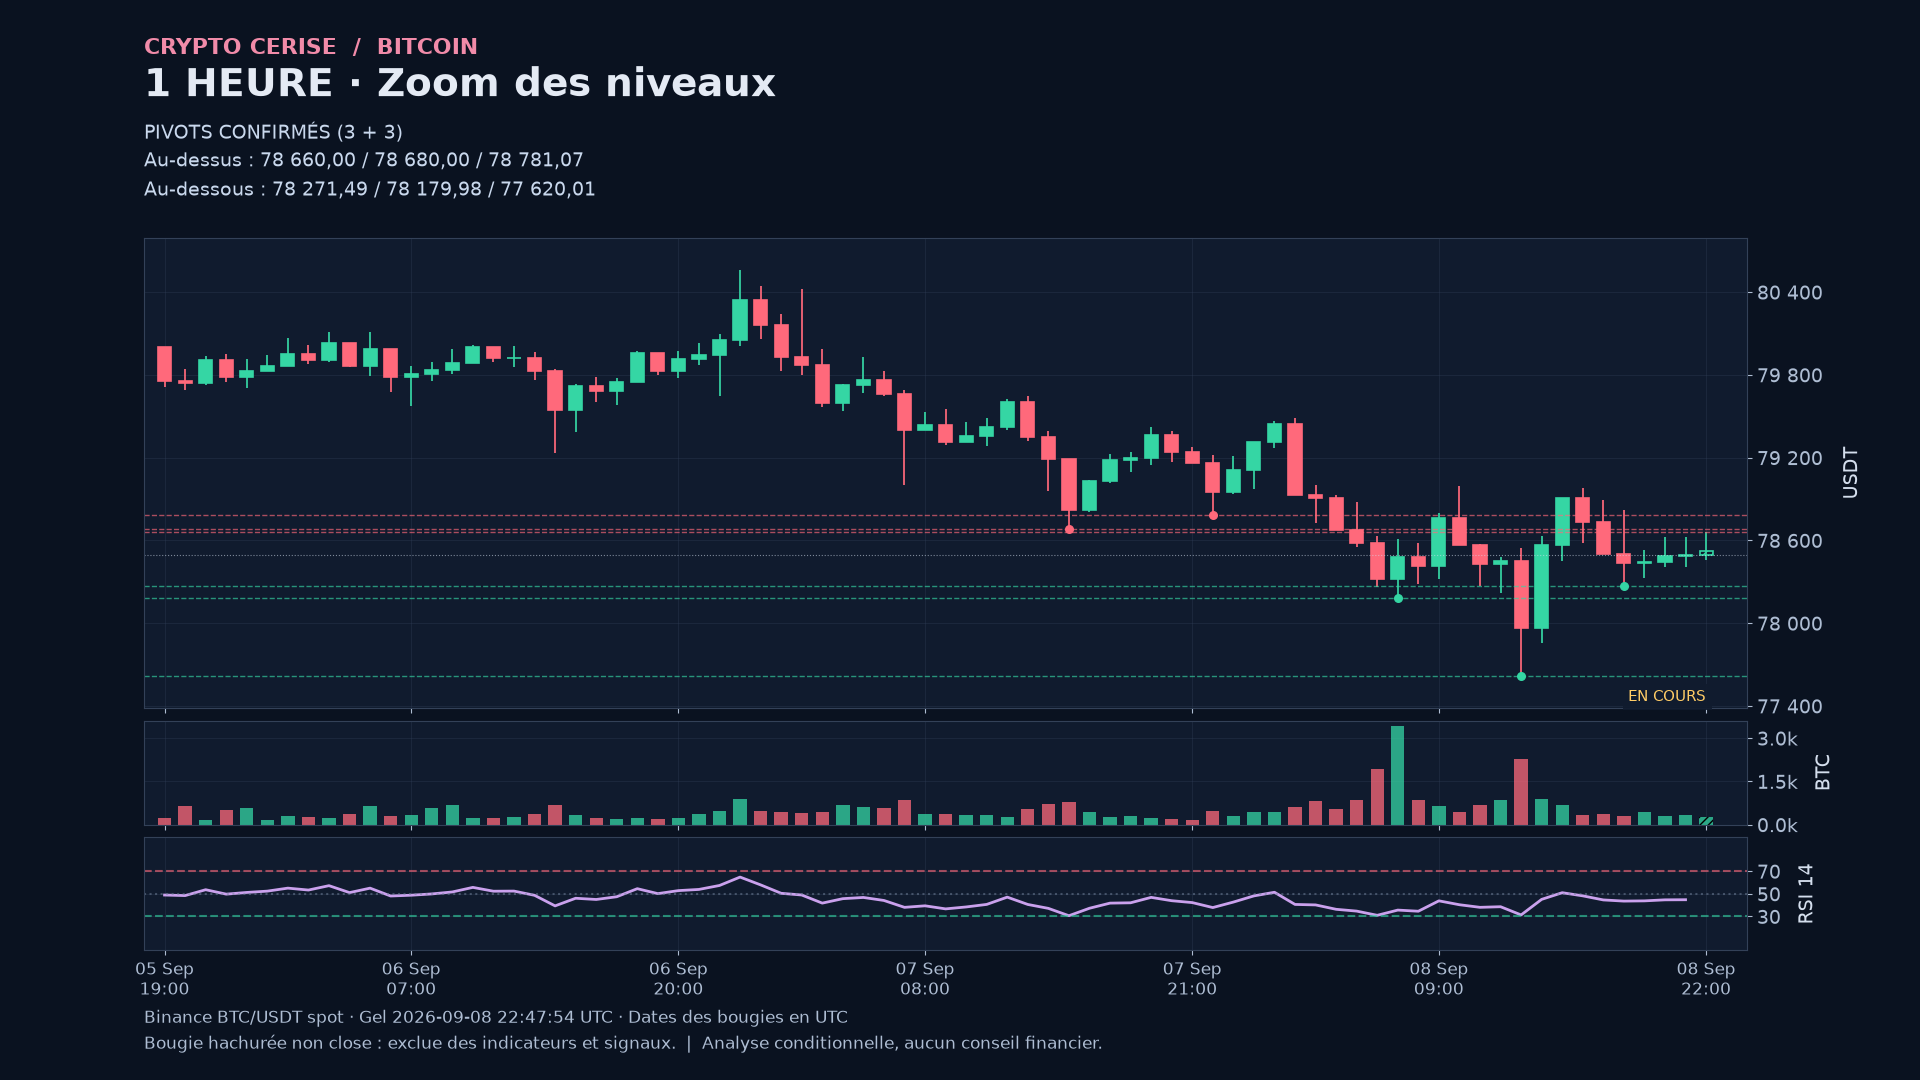
The last completed hour, just before 22:00 UTC, closes near 78,492 USDT. It remains below the 20-hour and 50-hour averages. RSI is around 45, below its midpoint. Below price, the day's confirmed hourly low is around 77,620. Above price, former lows around 78,660 to 78,680 become references to reclaim, not guaranteed resistance.
I am adding the fourteen-period RSI. This oscillator measures the momentum of gains and losses in closing prices, using Wilder’s smoothing. Fifty serves as the central reference point; thirty and seventy are conventional thresholds, not buy and sell buttons.
An extreme RSI can persist during a trend. We do not claim a divergence without comparing identified highs or lows in both price and the indicator.
08 — Three scenarios, and what would invalidate them
We finish with three possible paths. These are hypotheses for interpreting the charts, not forecasts or orders to place.
First scenario: short-term improvement. I would watch for an hourly close reclaiming the 78,660 to 78,680 USDT area, followed by a hold. The four-hour averages would then be the next test. A quick move back below the reclaimed area would invalidate this initial signal. It would not yet validate a break of the daily highs.
Second scenario: hesitation. While price remains between the low near 77,620 and that reclaim area, I retain the intraday consolidation hypothesis. An hourly close outside the interval followed by a hold would invalidate this neutral reading.
Third scenario: deterioration. A four-hour close below 77,620, followed by a failure to reclaim it, would strengthen the weakness interpretation. The area between the daily 20-period average near 76,747 and the confirmed daily low near 76,888 would then deserve reassessment. Sustainably reclaiming the lost level would invalidate this breakdown scenario.
An invalidation condition is essential: it specifies what would make us abandon a hypothesis rather than constantly shifting the reference points to be right. The next zones are areas to reassess if the scenario plays out, not guaranteed targets. And if the market confirms none of the conditions, drawing no conclusion is a perfectly acceptable response.
09 — Conclusion
My summary at the snapshot: a daily framework still constructive according to our averages and cloud, but short-term pressure. This disagreement between timeframes is precisely what deserves monitoring, rather than picking a side from one indicator.
There you have it, my little sweethearts. The monthly chart sets the scene, the weekly chart organizes the major zones, the daily chart carries the trend reading, and the four-hour and one-hour charts then let us watch the price response. Candles first, indicators second, and never the other way around.
The charts, calculations and sources are available on CryptoParadiz through the link below the video. This analysis is a dated snapshot, not live coverage. This content is for informational purposes and does not constitute financial advice. Cryptoassets are volatile and involve a risk of loss.
Appendix: calculated facts and conventions
Plotted levels are strict unique local extremes with three completed candles on each side, searched over the last 120 completed candles (or available history). We retain the three nearest below and above the last completed close. Zones are not statistically clustered: numerical proximity does not prove support. A former low can be above price and become a reference to reclaim.
EMAs are recursive, alpha=2/(n+1), seeded with the first available close and hidden until n observations; RSI14 uses an initial arithmetic mean followed by Wilder smoothing. The displayed volume ratio compares the last completed candle with the mean of the previous twenty completed candles. Volume is BTC and prices are USDT.
Ichimoku uses 9/26/52 with a displacement of 26 bar positions. The cloud at a date uses calculations from 26 bars earlier. Chikou is a retrospective representation of the close shifted 26 bars into the past; it is excluded from signals. The projection to the right does not predict price.
Independent price cross-check: Binance BTC/USDT at 78524.01000000 USDT, timestamp 2026-09-08T22:48:04.005000+00:00; Coinbase BTC/USD at 78509.83 USD, timestamp 2026-09-08T22:48:03.645243381Z. Quote currencies differ; no arbitrage spread is inferred.
Narrated figures are rounded to the nearest unit and explicitly approximate; charts retain more decimals. Moving-average references apply to this snapshot, not fixed thresholds forever. No backtest or predictive probability is claimed.
Sources and reproducibility
- binance_time_start — source consultée / retrieved source
- binance_1M — source consultée / retrieved source
- binance_1w — source consultée / retrieved source
- binance_1d — source consultée / retrieved source
- binance_4h — source consultée / retrieved source
- binance_1h — source consultée / retrieved source
- binance_ticker — source consultée / retrieved source
- coinbase_ticker — source consultée / retrieved source
- binance_time_end — source consultée / retrieved source
- Coinbase BTC/USD — contrôle / cross-check
- TradingView — Ichimoku Cloud
- TradingView — RSI
- Binance — schéma REST Spot / REST schema
- Données figées / frozen summary (JSON)
- Chiffres narrés / narration claims (JSON)